Perelman School of Medicine | University of Pennsylvania

| NGSC - FAQs |
Next-Generation Sequencing Core Perelman School of Medicine | University of Pennsylvania |

|
The NGSC offers a very rudimentary single-cell RNA-Seq analysis. Though the analysis is simple, it does provide a useful survey of the major patterns in the RNA-Seq data. We will be improving the pipeline shortly.
Out data analysis for a scRNA-Seq experiment is a two-step process. The first step is a standard differential expression RNA-Seq analysis. In many cases, the cells are from a single condition so no actual comparison is made. However, this process sets up a tabulation of all of the data, even when the samples have been sequenced over two or more lanes. The second step is single-cell specific. The goal of the analysis is to assess the complexity of the libraries and to estimate the number of cell types.
Many of the analysis techniques for identifying cell subtype use some variant of clustering. Often the library complexity for each cell exerts a strong influence over this clustering process. We therefore assess the complexity of the each cell by counting the number of genes detected. Cells with very low gene count can be discarded from subsequent analyses.
The raw gene detection counts are placed in detection.csv which shows the number of reads for each gene in each cell. In addition, the number of cells where the gene was detected are counted. The detection is simply one or more reads.
The detection data is plotted in global-heatmap.pdf which has two pages, see Figure 1. Page 1 shows a histogram of the number of number of cells detecting genes, e.g., how many genes are detected in all cells, half the cells, all cells but one. Page 2 shows the distribution of the number of genes detected in each cell. Commonly this is about 4,000 to 10,000 per cell with data from the Fluidigm C1 and moderate depth of sequencing.
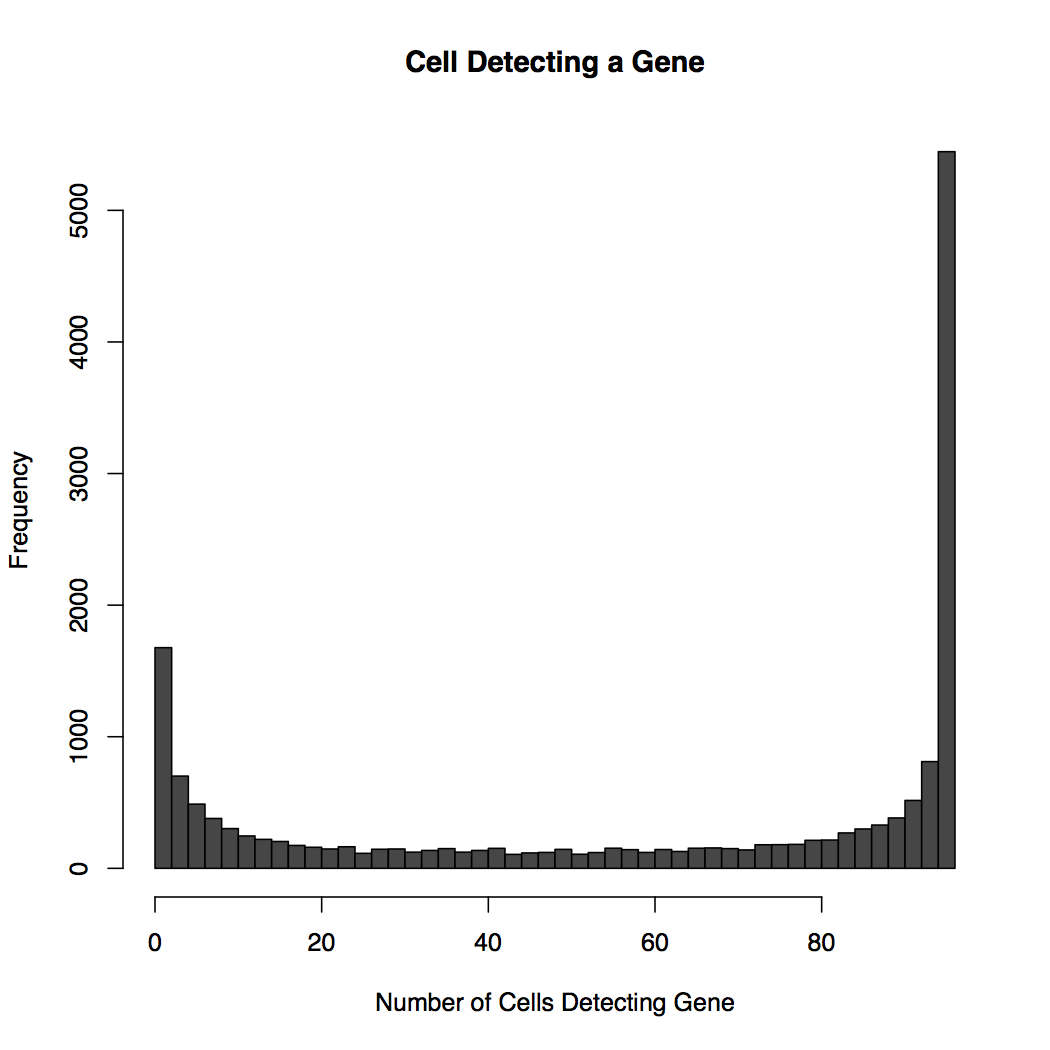
A - Frequency of the number of cells detecting a gene. At the left is a large number of genes detected in virtually all cells. At the left are a smaller number of genes not detected at all.
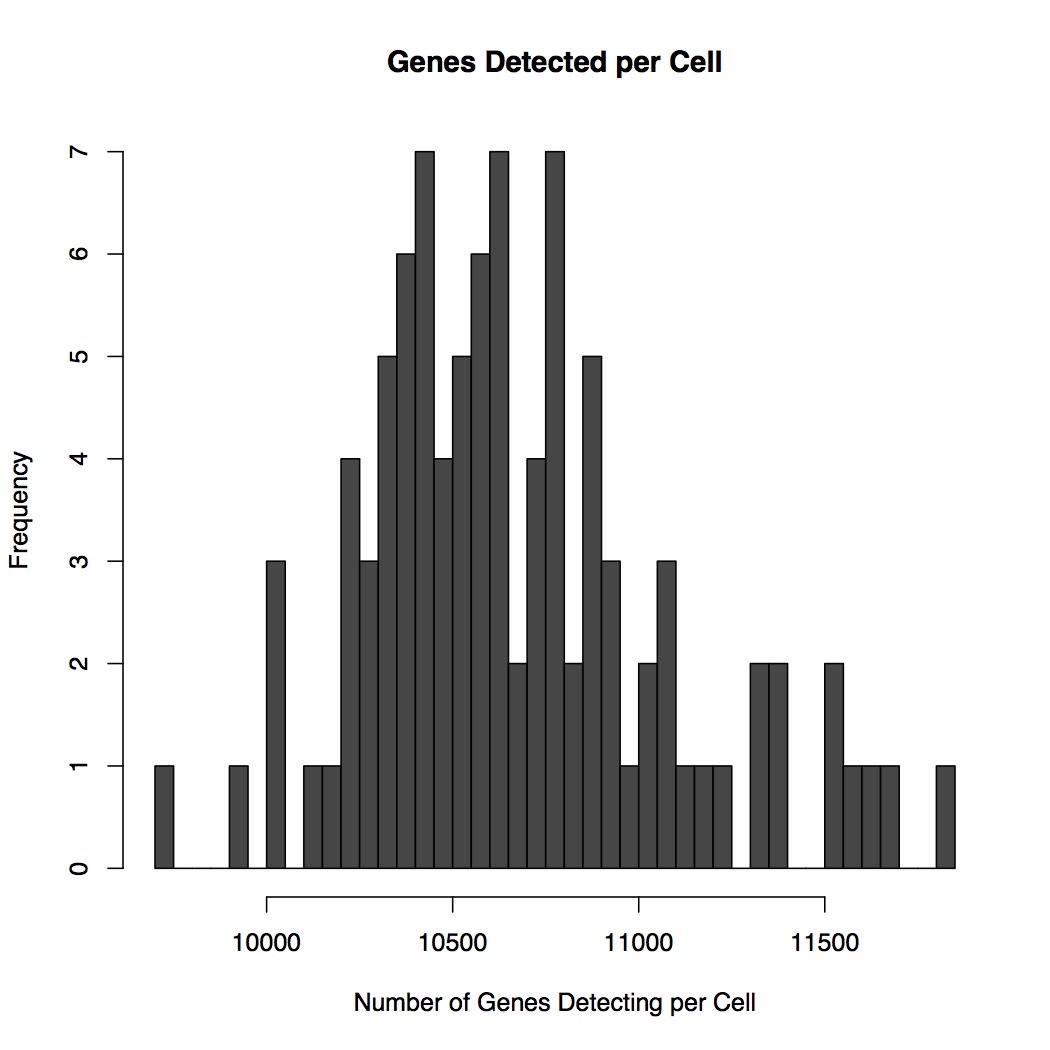
B - On average each cell is detecting about 11,000 genes. The few cells detecting 11,500 genes may be double captures, large cells, or intermediate cell types.
We use bi-clustering and multi-dimensional scaling to cluster the cells and genes, see Figure 1. We also present a heatmap version of the data. Generally not all genes are useful for clustering. There are different methods available for selecting these genes. We use the maximum expression across all cells. Genes are ranked by their maximum (normalized) expression. We take the top 100, 200, 300, 400, and 500 genes. (Our counts may be used at times.) For each threshold, we draw a heatmap of the genes across all cells, an MDS plot of all cells, and a MDS plot of the genes. In the cell plot, the cells are colored by the number of detected genes. The gene plot are colored by the number of cells where the transcript was detected. The MDS coordinates are also saved in csv files, one for each cutoff. These may be used to identify cells or genes of interest for subsequent analysis.
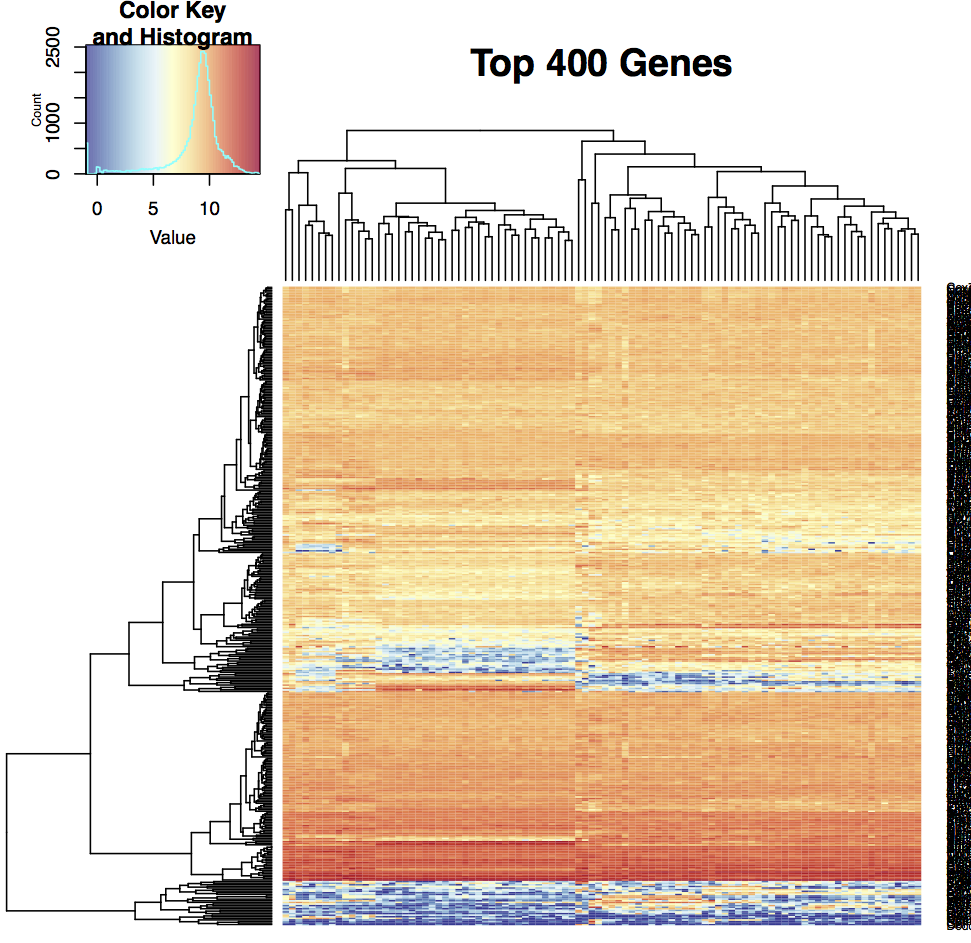
A - A heatmap of the 400 top expressed genes shows broad agreement but with pockets of cell-type specific changes. Each row is a gene, each column a cell.
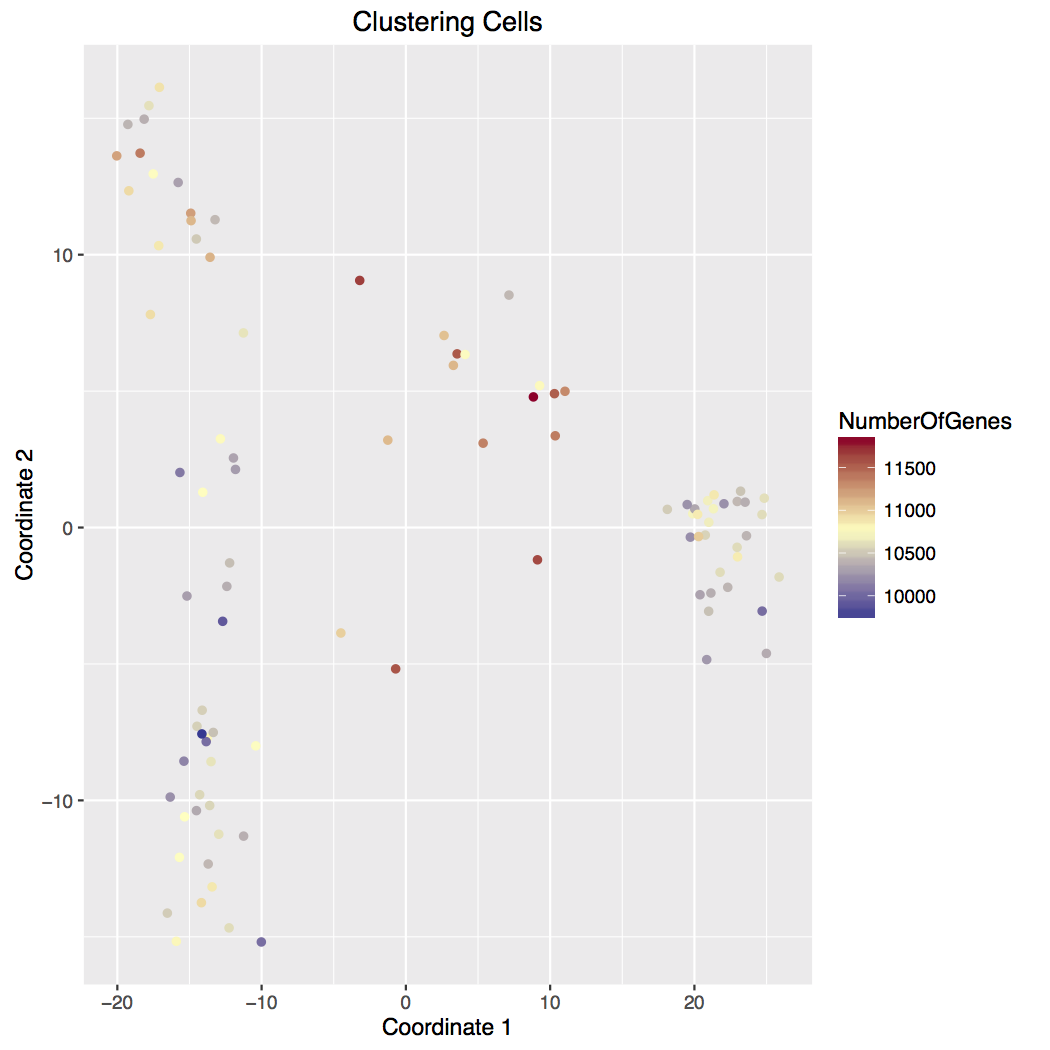
B - Cells analyzed with MDS indicate 3 major groups (top, bottom, and right) with possible intermediates (left and top). Top intermediates have higher detected gene count.
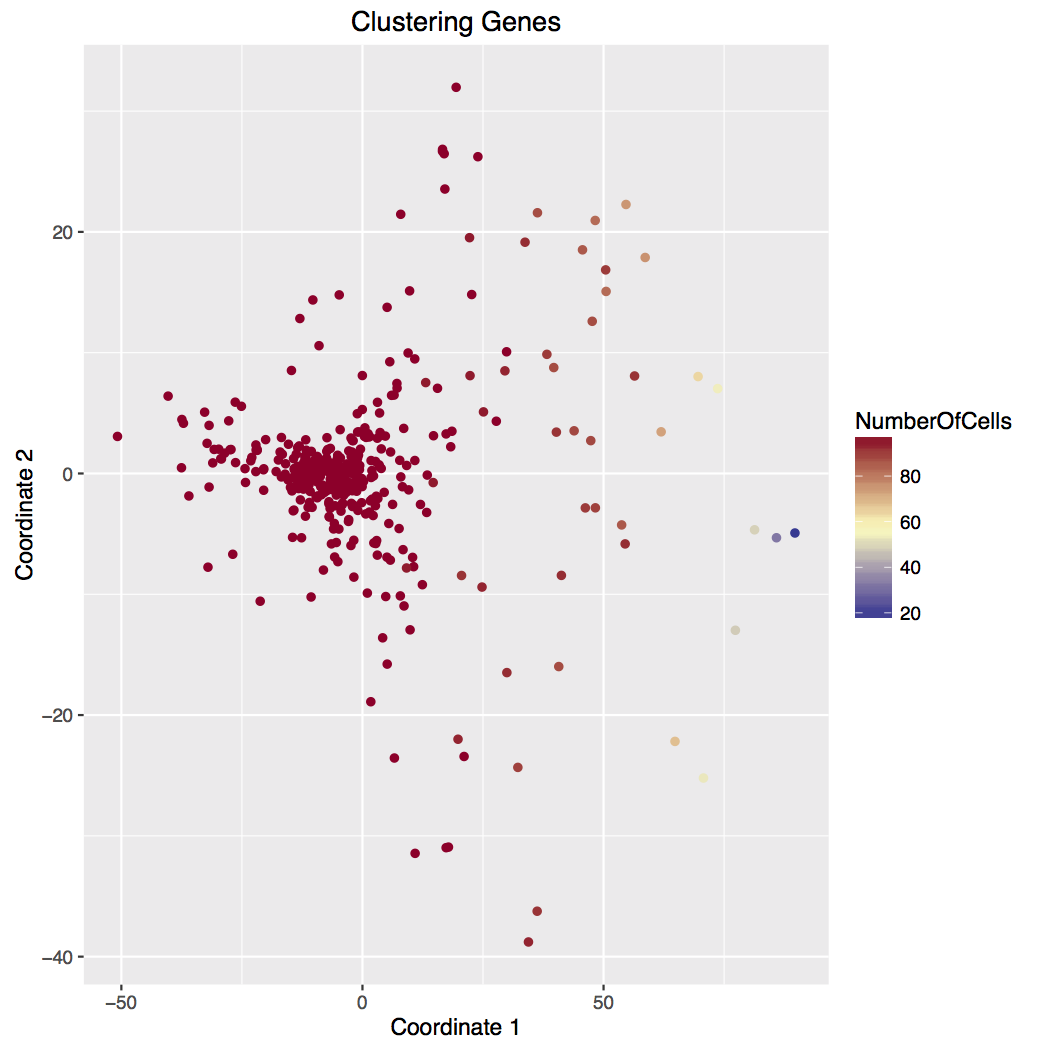
C - Genes analyzed with MDS indicate a detection frrquency component (right to left) and a possible cell-type component (top to bottom).